
Last night I had a discussion with someone regarding the widening income gap. At that time I mentioned the average executive-to-laborer pay went from about 60X in the 1960s to 600X today. In search of a data to support a memory of something I read years ago I performed a Google search. The first article that showed up was an interesting Forbes article from last year titled "Report: CEOs Earn 331 Times As Much As Average Workers, 774 Times As Much As Minimum Wage Earners.”
The Forbes article references a pretty cool graphical presentation on the matter by the AFL/CIO. My discussions last night led to a good point argued by many defenders[1] of the 1%: that workers are paid based on their productivity. However, looking at the data, workers are NOT paid based on their productivity on average. They are actually paid significantly less.
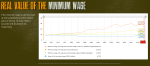
For example, if minimum wages kept up with productivity gains minimum wage would have grown to $18.30. However, minimum wages actually went down (in real dollars) since 1968 to the level of $7.25 in 2013. So where does the $18.30-$7.25=$11.05 go? To charitable organizations or executive pay? Maybe a little of both but I suspect most finds its way to executive compensation.
Some good news: results are based on averages. Therefore some companies are above (worse) and some are below (better) with the ratio of CEO-to-worker pay. Some time ago I thought about developing a score to rate companies and raise awareness of where a company falls in the CEO-to-worker pay spectrum. The AFL/CIO has already done similar work with their report card on 78 of the largest mutual funds.
With broader awareness perhaps the 99% could gradually migrate their investments (401k/IRA), purchases (where they shop), and employment (where they work) away from the worst companies and toward better companies. Perhaps that could help reverse the trend of the disappearing middle class and put us back on track to shared prosperity. Quizas, Quizas, Quizas.
I’ll leave with two graphs from the fancy graphical website referenced by the Forbes article, I hope it comes through in this post. If not, just visit the Executive Paywatch 2014 website and scroll down.
-

- screen shot 2015 04 26 at 7 54 42 am
-
- screen shot 2015 04 26 at 8 06 28 am
[1] The irony is most defenders of the 1% are not in the 1%. People are defending the status quo which will lead to further widening of the income and wealth gap. I don’t know what is best for someone else. However, defending a position that makes yourself personally further behind (relative to 1% income/wealth) is defending concentrated prosperity. Marx and Schumpeter had some pretty grim predictions about what happens after prosperity concentration.
